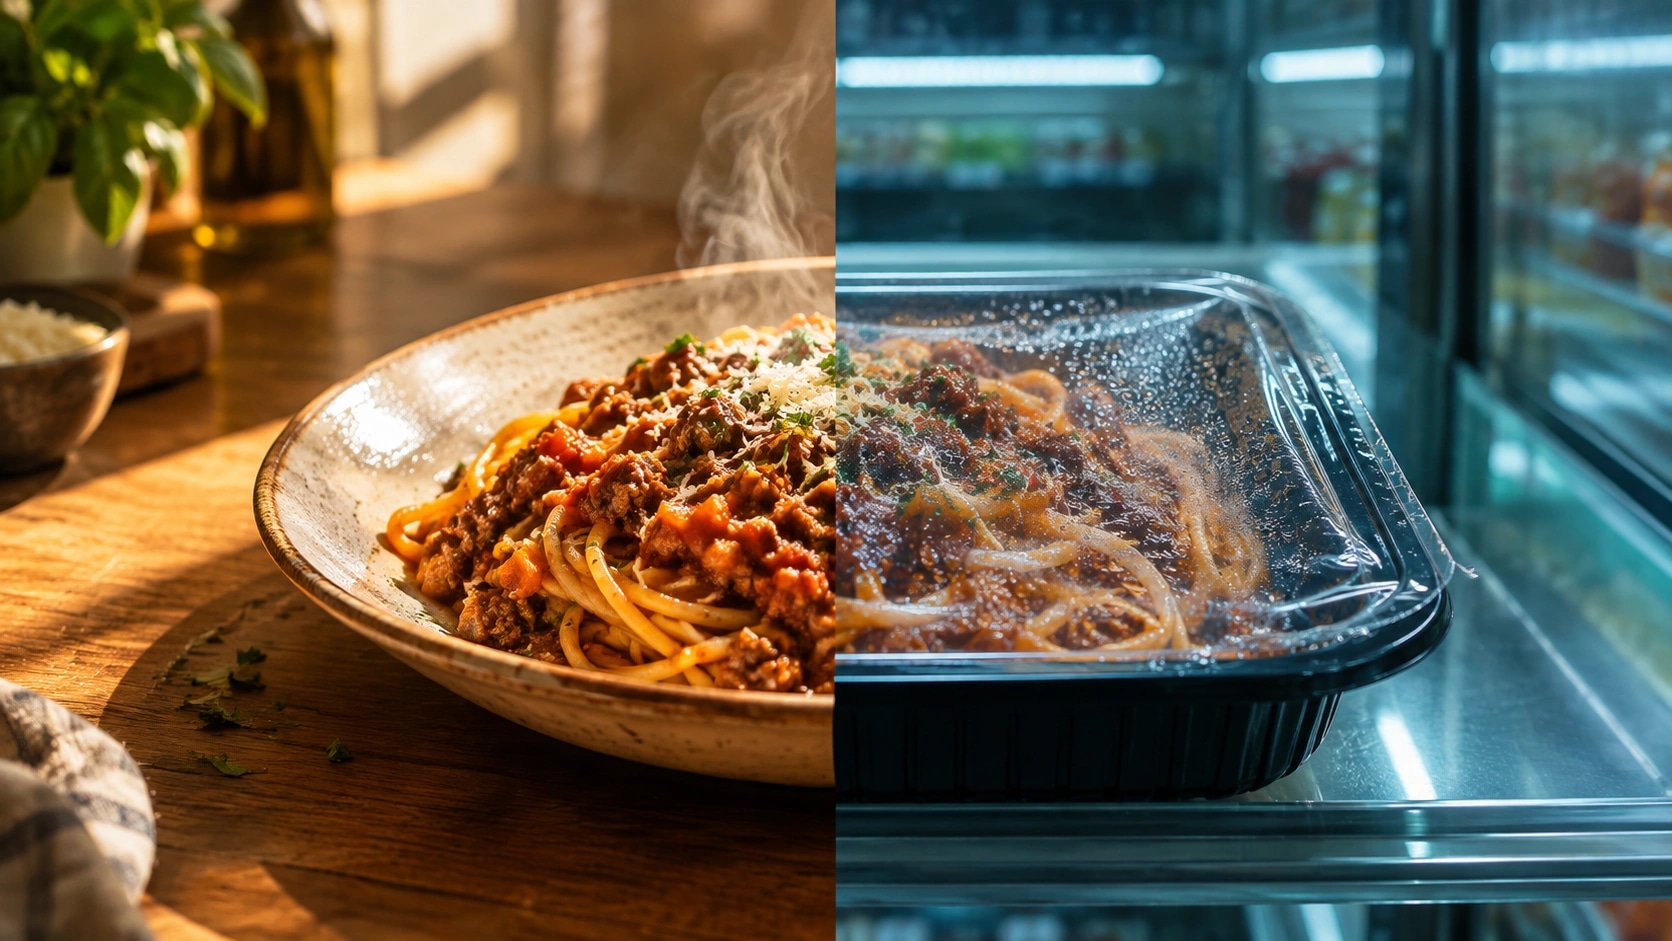
Twenty people spent a month living inside a research hospital in the United States. They were fed two diets in turn, two weeks each. Before it started, the researchers matched everything people usually blame for weight gain: calories on the plate, sugar, salt, fat, protein, fibre. One thing differed - how heavily the food had been processed. On the industrial diet, people ate 508 more calories a day and put on nearly a kilogram in two weeks. On the home-style diet they lost the same amount. Nobody was told to hold back: on both diets they could eat as much as they wanted.
Ultra-processed food is not harmful only because it carries a lot of sugar, salt and fat. Its defining trick is that people eat more of it than they meant to - even when the nutrition label is matched. Ultra-processed foods (often shortened to UPF) are products assembled in a factory from refined ingredients and industrial additives: flavourings, colourings, sweeteners, emulsifiers (substances that stop water and fat from separating). Here is what the science shows, where it argues with itself, and how to identify one of these products in about ten seconds.
What ultra-processed food actually means
Ultra-processed food is not a synonym for junk food. It is food built industrially out of parts of foods rather than cooked from whole foods. Flour, starch, sugar, vegetable oils and protein isolates (pure protein pulled out of a raw material) are produced separately first. Then a new product is assembled from those parts, and additives fix the taste, colour and shelf life.
The system came from a team led by Brazilian researcher Carlos Monteiro in 2009. It is called NOVA, and it sorts food by industrial handling rather than by calories, into four groups:
- Group one - unprocessed and minimally processed: vegetables, grains, meat, fish, eggs, milk, plain frozen fruit.
- Group two - culinary ingredients: oil, salt, sugar, flour. Rarely eaten alone, used to cook with.
- Group three - processed foods: bread, cheese, pickles, tinned fish. A group one food plus a group two ingredient, and little else.
- Group four - ultra-processed: soft drinks, sausages and deli meats, instant noodles, crisps and snacks, ready meals, packaged cakes, sweetened breakfast cereals, cereal bars, packet soups.
A working rule of thumb: if you could reproduce the ingredient list in your own kitchen, it is probably group three. If the list contains substances no household keeps, it is group four.
This classification has serious critics, and the argument is live right now. We will come back to it near the end, because it changes the practical advice. First, what experiments have actually shown.
The experiment that matched the nutrients - and still saw a difference
The strongest evidence did not come from diet questionnaires. It came from a ward. In 2019 Kevin Hall's team published a trial in Cell Metabolism in which participants lived in a clinic for a month and ate only what they were served.
There were twenty of them - ten men and ten women, average age 31, average body mass index 27 (slightly overweight). The design was a crossover: everyone did both diets in turn, so each person was compared with themselves rather than with a different group. That removes differences in metabolism, habits and personality.
The detail that matters is what was held equal. Both diets matched on calories served, energy density (how many calories sit in each gram of food), protein, fat, carbohydrate, sugar, sodium and fibre. Everything usually blamed was identical.
The result: on the ultra-processed diet people voluntarily ate 508 more calories a day. The surplus came from carbohydrate (280 calories) and fat (230 calories); protein intake did not move. Participants gained 0.9 kg over two weeks on it and lost the same 0.9 kg over two weeks on the unprocessed diet. Hormones shifted too: on the unprocessed diet PYY rose (the hormone that tells the brain you are full) and ghrelin fell (the hormone that switches hunger on).
The trial has honest limits: twenty people, four weeks, and two diets that differed in more than processing alone - food form, how appealing it tasted, and where the fibre came from. Critics later flagged exactly that. Still, the core finding holds: the nutrients were matched and people ate more anyway.
So if it is not the sugar and not the fat, what is it? The next experiment gave a surprisingly specific answer.
Why you eat more: speed, not willpower
People eat industrial food faster, and they finish before fullness arrives. In Hall's trial, eating rate on the ultra-processed diet was higher by 17 calories and 7.4 grams per minute. The fullness signal travels from the gut to the brain with a delay of several minutes. If the plate empties inside that window, the signal reaches an empty plate.
Picture two identical glasses of water. One you drink in a single gulp, the other you sip over ten minutes. Same water, different experience. Food works the same way, except chewing and texture do the work of the sips.
To test whether texture really was the driver, Ciaran Forde's team at Wageningen University in the Netherlands ran a separate trial. Forty-one participants ate two ultra-processed diets. Both were group four, matched for energy density, portion size and calories served. Only the texture differed: some meals demanded chewing, others slipped down almost instantly.
The gap was 369 calories a day in favour of the slower meals. Over fourteen days that added up to more than 5,000 calories - roughly a week of normal eating. And it happened without instructions: nobody was told to eat less, nobody counted anything, and nobody reported feeling deprived.
Eating speed is a lever that works without bans. It does not replace everything else, but you can use it at dinner tonight.
An obvious objection: maybe the industrial diet was just crisps and cola while the home diet was vegetables and chicken. That got its own trial, and the answer is interesting.
What if the ultra-processed version is officially healthy?
Even when both diets follow official healthy-eating guidance, the less processed one wins. In August 2025 Nature Medicine published a trial run by Samuel Dicken's team at University College London.
Fifty-five adults in England with overweight or obesity took part, all of them already getting at least half their calories from ultra-processed food. Each person ate two ways for eight weeks apiece, with a four-week break in between: minimally processed food, and ultra-processed food. Both menus were built to the UK Eatwell Guide, so both counted as healthy on paper - overnight oats and homemade bolognese against an oat breakfast bar and a lasagne ready meal. People could eat as much as they liked.
Weight fell on both. But the minimally processed diet produced a 2.06% drop against 1.05% on the ultra-processed one: roughly 1.8 kg versus 0.9 kg, twice as much, with no limits on portions. Fat loss was also more than double, and participants said they felt more in control of cravings.
British specialists named the weak spots immediately, and they are worth knowing. Tracy Parker of the British Heart Foundation pointed to the small sample and the fact that 91% of participants were women. Nerys Astbury of Oxford noted that with this design the order of the diets could have shaped the result. Kevin McConway of the Open University added that only one diet from each category was tested, not every possible version. Gunter Kuhnle of the University of Reading observed that group three processed food was never compared against group four here.
Two experiments add up to 75 people. Next comes statistics on millions.
What ten million people show
Population studies link ultra-processed food to 32 adverse health outcomes. In 2024 the BMJ published an umbrella review by Melissa Lane - a study that pools meta-analyses that already exist. It covered 45 pooled meta-analyses from 14 reviews, close to 10 million participants in total. None of the reviews were funded by companies making this kind of food.
The authors sorted findings by strength of evidence:
- Convincing evidence: death from cardiovascular causes, around 50% higher risk; anxiety and other mental health conditions, 48-53% higher; type 2 diabetes, 12% higher.
- Highly suggestive evidence: death from any cause, 21% higher; depression, 22% higher; plus obesity and sleep problems.
- Weak evidence: links to asthma, gut conditions and some cancers remain limited.
The authors add an important caveat. These are observational studies (they watch what people already do rather than assign a diet). They show association, not proof of cause, and unmeasured factors such as income, smoking or overall lifestyle cannot be ruled out. An umbrella review gives the view from above, not a verdict on each line.
Research published in 2026 filled in detail. The American Journal of Medicine reported on 4,787 American adults: the heaviest consumers carried a 47% higher risk of cardiovascular disease than the lightest, after adjusting for age, sex, background, smoking and income. The authors say plainly that large randomised trials are still needed.
A second paper looked at the brain. Researchers from Monash University, the University of Sao Paulo and Deakin University studied more than 2,100 middle-aged and older Australians without dementia. Every 10% rise in the share of ultra-processed food matched a measurable drop in attention and mental processing speed. "We saw a distinct and measurable drop in a person's ability to focus," said lead author Barbara Cardoso. The effect held even among people otherwise eating a Mediterranean-style diet. A link to dementia itself was not established - this is about an early signal.
A third paper explains why the sugar-salt-fat list is not enough. The Food is Medicine Institute at Tufts University analysed twenty years of US dietary surveys (1999-2018) and published the result in the American Journal of Public Health. The risks persisted even after adjusting for the nutritional quality of the foods, their saturated fat, added sugar and sodium. Every 10% increase in calories from ultra-processed food meant higher body weight, worse blood sugar control, higher blood pressure and less favourable cholesterol. As possible causes the authors name damage to the food's cellular structure, loss of beneficial compounds, the additives themselves, and chemicals migrating from packaging. That last one overlaps with what is known about microplastics and what is actually proven about them.
The list reads alarmingly. But there is a second side to this picture that popular articles rarely mention.
The turn: not all of group four is equally bad
No, not every ultra-processed product is harmful in the same way, and nutrition researchers say so themselves. A critical review of the NOVA system in Proceedings of the Nutrition Society argues that the category is too mixed to judge as a block.
Inside the same group four, the data pull in different directions:
- Sugar-sweetened drinks and some snack foods are consistently tied to bad outcomes.
- Fortified breakfast cereals and bread products have shown an inverse association with cardiovascular disease in several analyses.
- Certain yoghurts and dairy desserts behaved neutrally or protectively.
- Plant-based alternatives were linked to lower type 2 diabetes risk.
Hence the paradoxes. A pie made at home from flour, butter and sugar counts as minimally processed simply because it was made at home. The same pie from a factory lands in group four. Fortified cereal and cola share a bucket while behaving nothing alike.
There are methodological complaints too. Diet questionnaires predate NOVA and cannot separate a shop-bought dish from a homemade one. And the Hall trial diets, as noted, differed in more than processing.
The reviewers do not conclude "relax". They conclude that a more precise system is needed instead of a blanket ban. For a reader the practical meaning is the same: crossing out all of group four makes little sense, cutting its worst subtypes makes a lot. Sweet drinks lead that list - there is a separate breakdown of what one can does to your body.
So the question is not whether to eat this food, but how much. And on that, countries differ enormously.
How much of it the world eats
The share of ultra-processed food in the diet ranges from a few percent to nearly two thirds, depending on the country. Across 22 European countries the range runs from 14% to 44% of total energy, based on national dietary surveys classified with NOVA. By region:
- United Kingdom and Sweden - top of the European table, with the UK holding above 50% for the past two decades.
- Italy and Romania - bottom of the European table, near the low end of the range.
- Spain - up from 11% to 32% over three decades.
- United States - 55.0% of all calories nationally in 2021-2023. Children and teenagers 61.9%, adults 53.0%.
- Mexico and Brazil - up from 10% to 23% over forty years.
- China - up from 4% to 10% over thirty years.
- Ethiopia - 5.1% among children and 3.5% among women of reproductive age; urban children encounter it at more than double the rate of rural ones.
- Russia and Kazakhstan - no national estimates could be found in the open scientific literature, so the honest answer is that the figures are unknown.
Two things stand out. First, the driver of growth is not hunger but the shift from home cooking to bought food, and it moves fastest where urbanisation is recent. Second, the rise is not unstoppable. In the US the adult share fell from 55.8% in 2013-2014 to 53.0%, and the teenage share from a peak of 65.6% in 2017-2018 to 61.9% - the first sustained decline in a decade.
The market is vast all the same. In November 2025 The Lancet published a three-paper series putting annual sales of this food at 1.9 trillion dollars. "The growing consumption of ultra-processed foods is reshaping diets worldwide," said Carlos Monteiro of the University of Sao Paulo, who created the classification.
A national figure says little about your own plate. You can check that yourself, and it is quick.
How to spot an ultra-processed product in ten seconds
The ingredient list on the back beats the picture on the front every time. At the shelf:
- Read the ingredients to the end. Five or more items, several with unfamiliar names, is the first marker.
- Look for what your kitchen does not stock. Emulsifiers, stabilisers, flavourings, sweeteners, modified starch, protein isolates, colourings. Nobody keeps these at home.
- Ask whether it needs chewing. Soft, melting, swallowed with almost no effort - that is the food that disappears before fullness arrives.
- Distrust the claims on the front. "Fitness", "high protein", "no added sugar", "source of fibre" appear most often on group four products.
- Compare it with the homemade version. Build the product mentally in your own kitchen. If it needs factory equipment, it is group four.
The check takes about ten seconds and beats any list of banned products, which goes out of date with every new recipe.
What to do when you have no time to cook
Total avoidance is unnecessary and, for most people, unrealistic. Three levers do the work without moving to a farm.
Slow down. The most underrated move: same diet, several hundred fewer calories a day. Put the fork down between bites, drink water with the meal, and pick versions that need chewing - a whole apple over juice, porridge over a breakfast bar, nuts over crisps.
Cut the worst first. Subtypes within group four are not equal. Sweet drinks carry the most consistent link to poor outcomes, so start there. Replacing one drink a day beats a heroic attempt to rebuild your entire diet over a weekend.
Add rather than forbid. A plate with protein, vegetables and whole grains leaves little room for extra calories. It works more quietly than bans and lasts longer - much like the daily step count, where the round number turned out to be a myth and the benefit started far earlier.
Some of this is not on the individual at all. The Lancet series authors argue that personal discipline is not enough and propose policy: warning marks on the front of packs, limits on marketing to children, bans in schools and hospitals, limits on supermarket shelf space, and taxes on selected categories funding cheaper fresh food. Brazil was the first country to tell its population outright to avoid ultra-processed food in national dietary guidance, and it has capped the share of school meal spending that can go on processed and ultra-processed products - down to 10% by 2026.
What it adds up to
Back to those twenty people in the clinic. Nobody lectured them, scared them or restricted them - food was simply served. One difference in how that food was made handed them 508 extra calories a day and a kilogram in two weeks. Not because their willpower was weak. Because industrial food is engineered to be easy to eat quickly and in quantity.
The good news is that the same mechanism runs in reverse. Food you have to chew limits itself.
Do this today: take one product you eat almost every day and read its ingredient list to the last line. One minute. What you do next is yours to decide - but now you know what you are reading.
Sources
- Hall K. et al. Ultra-Processed Diets Cause Excess Calorie Intake and Weight Gain. Cell Metabolism (2019)
- Lane M. et al. Ultra-processed food exposure and adverse health outcomes: umbrella review. BMJ (2024)
- The Lancet Series on Ultra-Processed Foods and Human Health (2025)
- Dicken S. et al. Ultraprocessed or minimally processed diets. Nature Medicine (2025)
- Science Media Centre: expert reaction to the Dicken trial (2025)
- Forde C. et al. Eating rate has sustained effects on energy intake from ultra-processed diets. Wageningen University (2025)
- CDC/NCHS. Ultra-processed Food Consumption in Youth and Adults: United States, 2021-2023 (2025)
- Tufts University. American Journal of Public Health (2026)
- Willett Y. et al. The American Journal of Medicine (2026)
- Cardoso B. et al. Alzheimer's & Dementia: Diagnosis, Assessment & Disease Monitoring (2026)
- Are all ultra-processed foods bad? A critical review of the NOVA classification system. Proceedings of the Nutrition Society
- Ultra-processed food consumption in adults across Europe (2022)
- Ultra-Processed and Less-Processed Foods Consumed in Ethiopia: National Food Consumption Survey